
To use the metaphor flat-line, if it applies to your heart is a bad thing. However your application ideally should have the same latency (delay) always. When it does not have flat-line (constant) latency, what should you investigate? Why is it important to investigate? Should your application run at the same speed always?
A very common misconception is: “oh but the system is busier, so it is supposed to be slower.” In fact, in some cases an application performs better under load. Caches stay warm. Virtual memory has “all the right memory” paged in and active. Many complex applications are horribly slow in their first seconds or sometimes minutes after start-up. When an application has complex states, many dependent libraries, and so on, it takes time to initialize and warm up the system. When we measure an interactive application we discuss the latency, which means how long does it take for a request, from the beginning of the request, until the end of the answer.
But I have not proved my point—why is flat-line latency a goal? To explore this performance principle, I am going to make it easier to see by not starting with a complex, real-world example. (Don’t worry—I’ll get back to that!) Let us assume this “Easy Service” has some simplifying assumptions:
- Each operation takes the same amount of work
- Each operation is independent of every other one
- No other work occurs on this computer
If the response time or latency of our application is constant regardless of load, that seems pretty ideal, right? But it should be the expected result. Starting from here, I propose we conduct a test. We will create a benchmark, it will send typical calls to our service at a controlled rate. (Those of you hang out with QA folks may have come across JMeter or Gatling, for example, to create such tests.) And with that in hand, I want to tackle a statement I hear way too often: “Of course the server is slow, the load is high. The more load, the slower a server goes.” Now that we have built a benchmark, we can play mad scientist and have a controlled experiment!
The Performance Under Load Experiment
If I remember that application start-up can be slow, I start by suggesting we have a few minute warm-up period. After that, let us set the rate at a series of increasing levels. If we do that, the statement above suggests I would get the orange line below if I graph latency (delay) across a range of load:
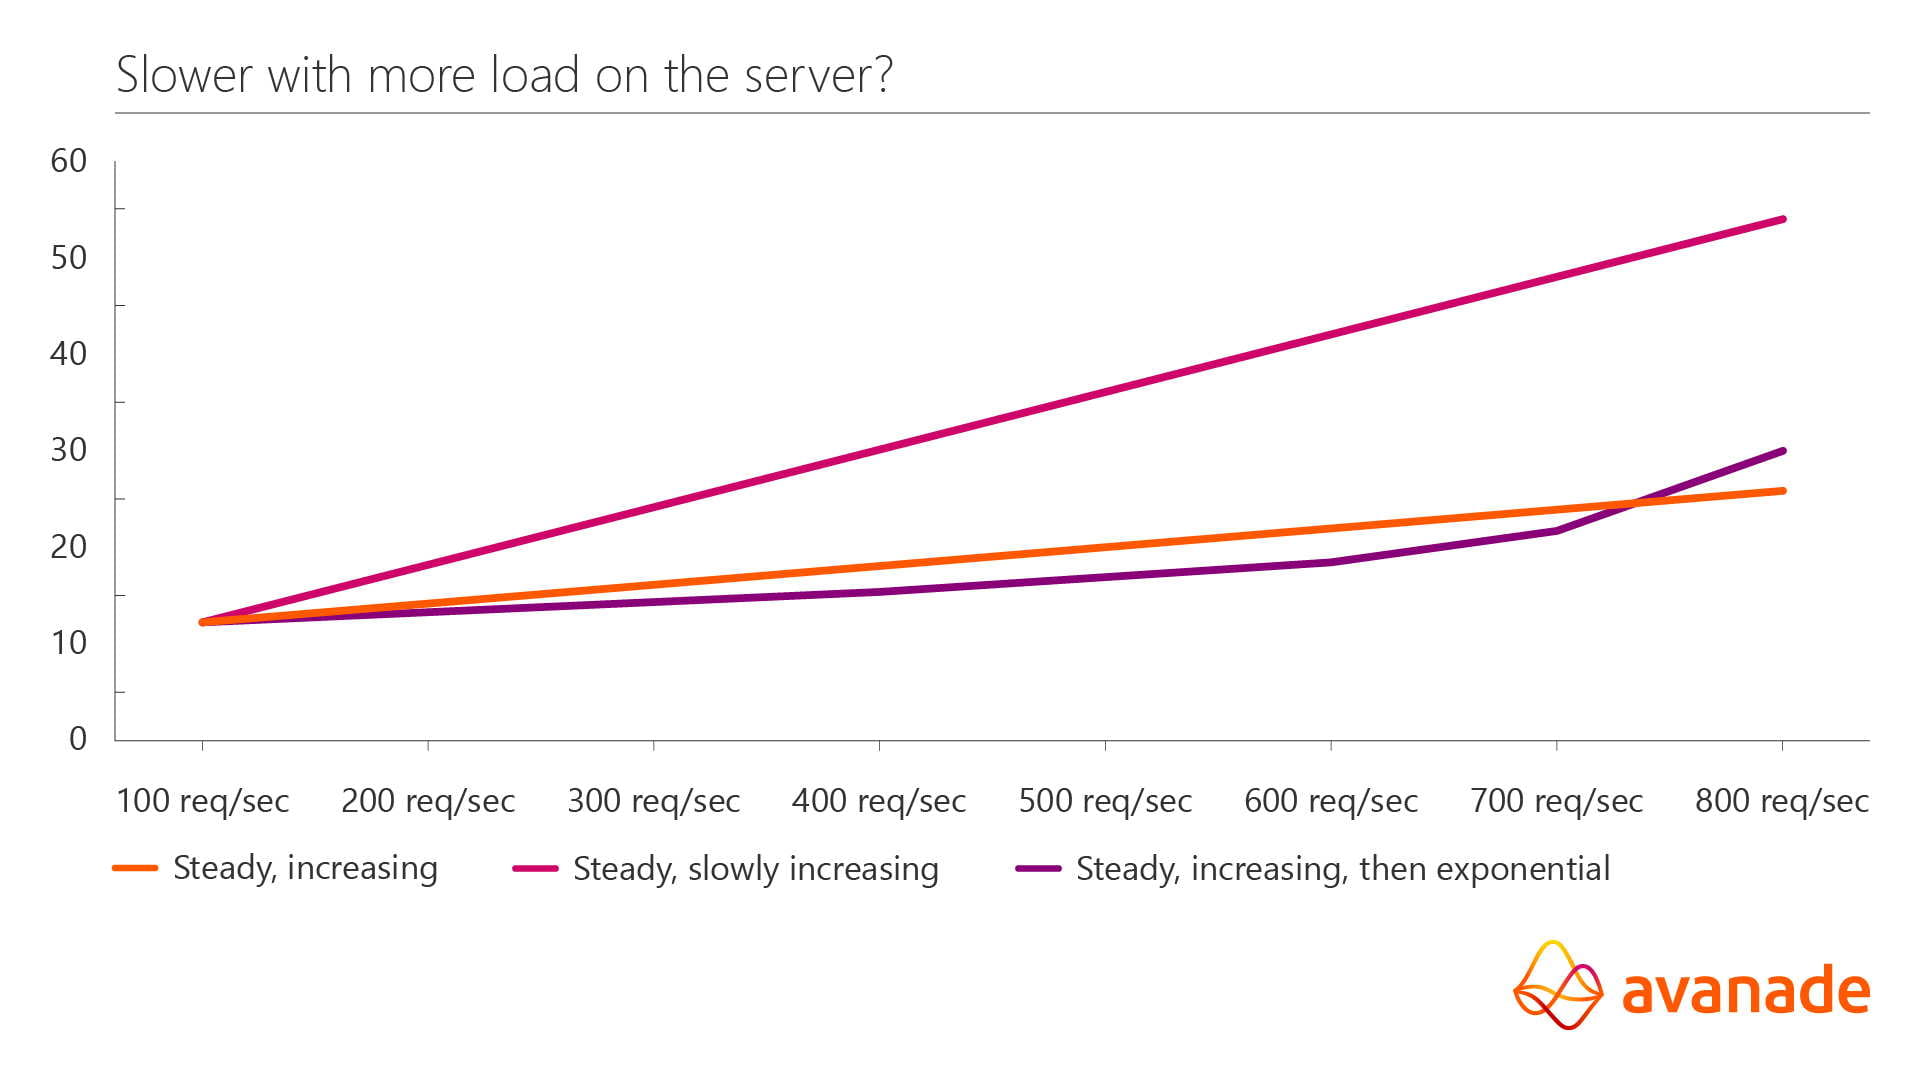
It turns out the orange graph is nearly impossible to have in real life. But let’s table that for later. What do we get in the scenario I proposed?
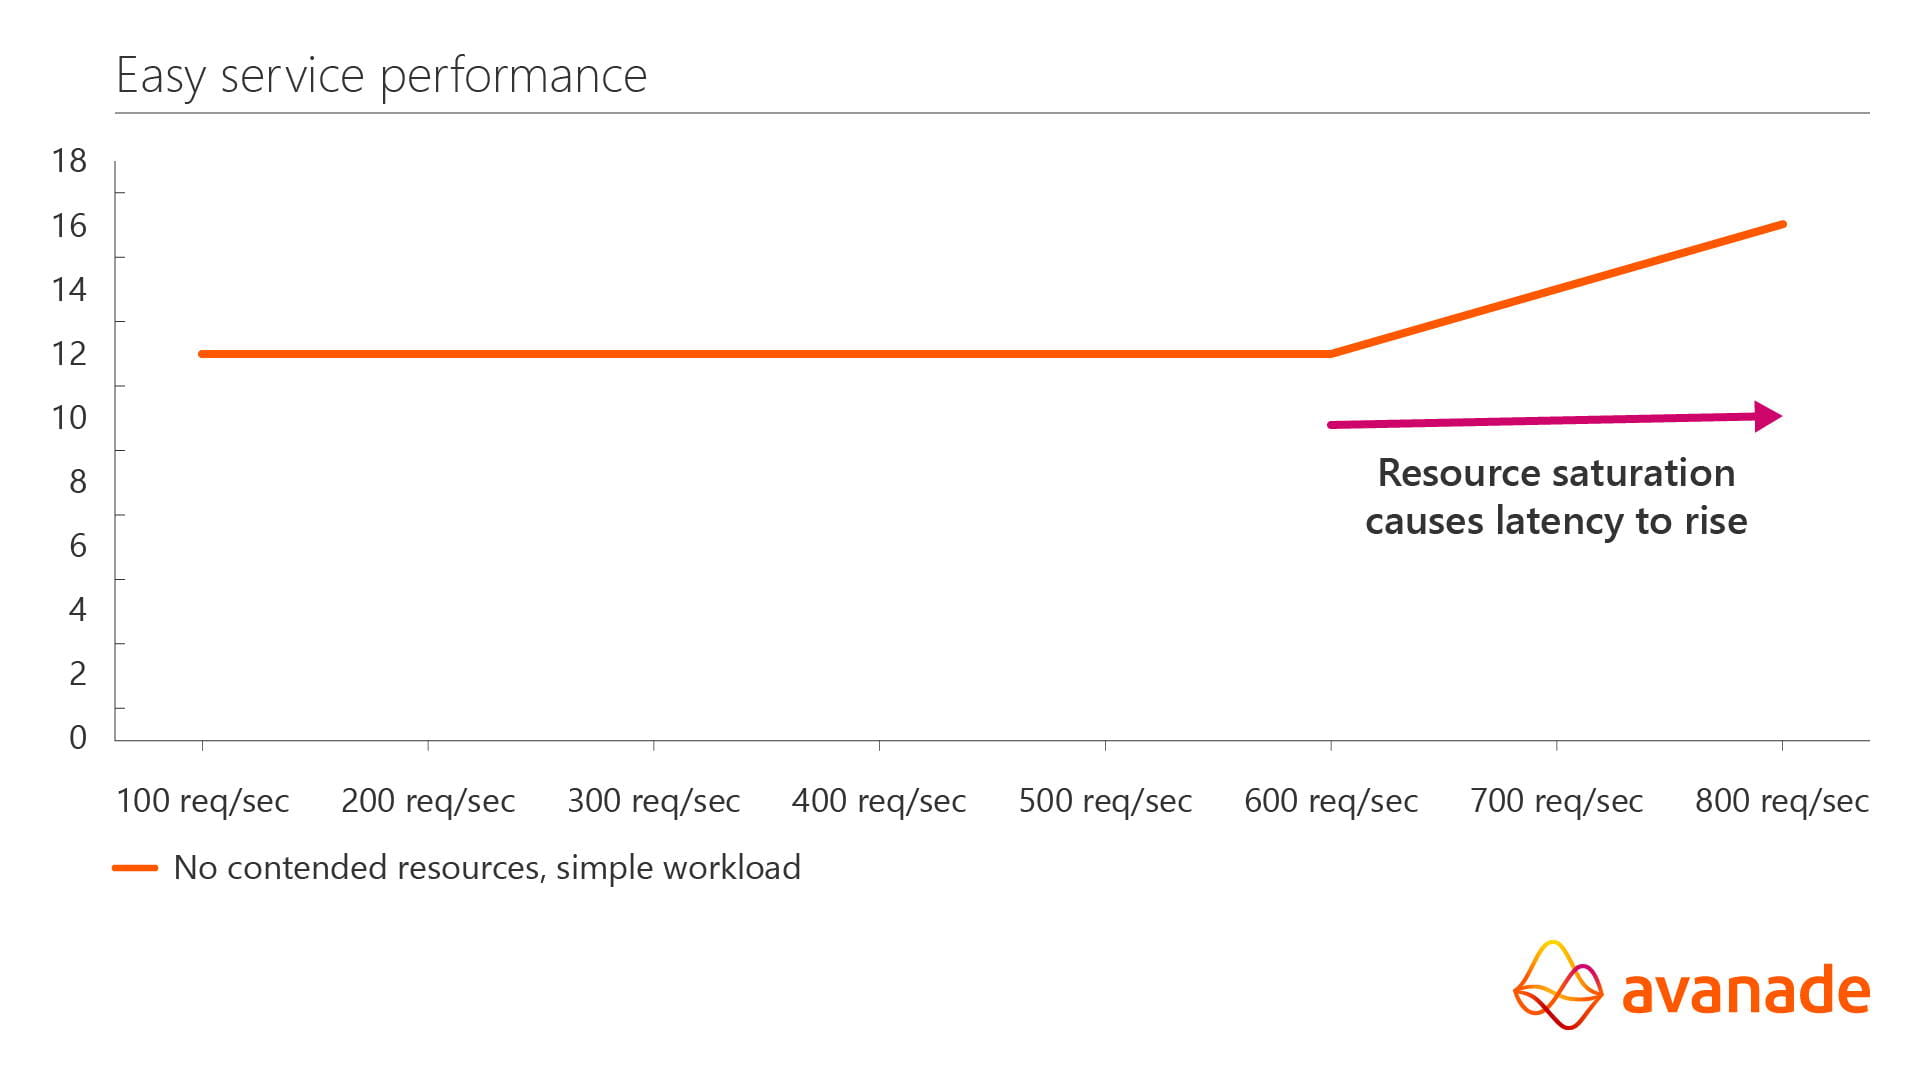
Whoa! We had a flat-line—and then a shock! What happened? We had flat latency until a resource got saturated or contended. (See my last article, where I talked about how to track down saturated resources.) Look what else we see though: latency is a flat linear line for our carefully constructed case! Did you expect that?
Expectations
These principles are showing what you should expect for a well-behaved application. Here is the key take-away: latency increasing is not expected just because of load. Another factor has to be at play, and the example given here is typical of resource saturation.
But you don’t have that application, do you? In fact, you are probably supposed to though. Let me start with an example based on CPU saturation. In IT, people tend to have this idea that ‘You should never provision to go over (some value between 25-50)% CPU usage. That is bad!’ Not at all! I have seen plenty of well-tuned and carefully engineered applications run at 75-80% CPU usage. Sadly, that is not common, and that is why that kind of “common knowledge” exists.
When you stay below that magical percentage, whatever that may be for your application, you should go back to the flat-line expectation though. You have stayed clear of resource saturation. If you also have avoided any contention problems inside your application, then you should get something kind of close to that ideal. When you do not get flat-line response, and you have stayed below resource saturation, something in your app is performing worse under pressure.
Real Applications
As a bit of basic health, you should check resource saturation. That is easy and obvious. Now let’s leave behind the ideal conditions I proposed. Not all calls have the same latency, consume the same resources, and can interfere with each other. You can use the type of graph here to help you find where your limits and problems are, and to verify if you make this better or worse. Still hypothetical, but inspired from many typical apps I have worked on:
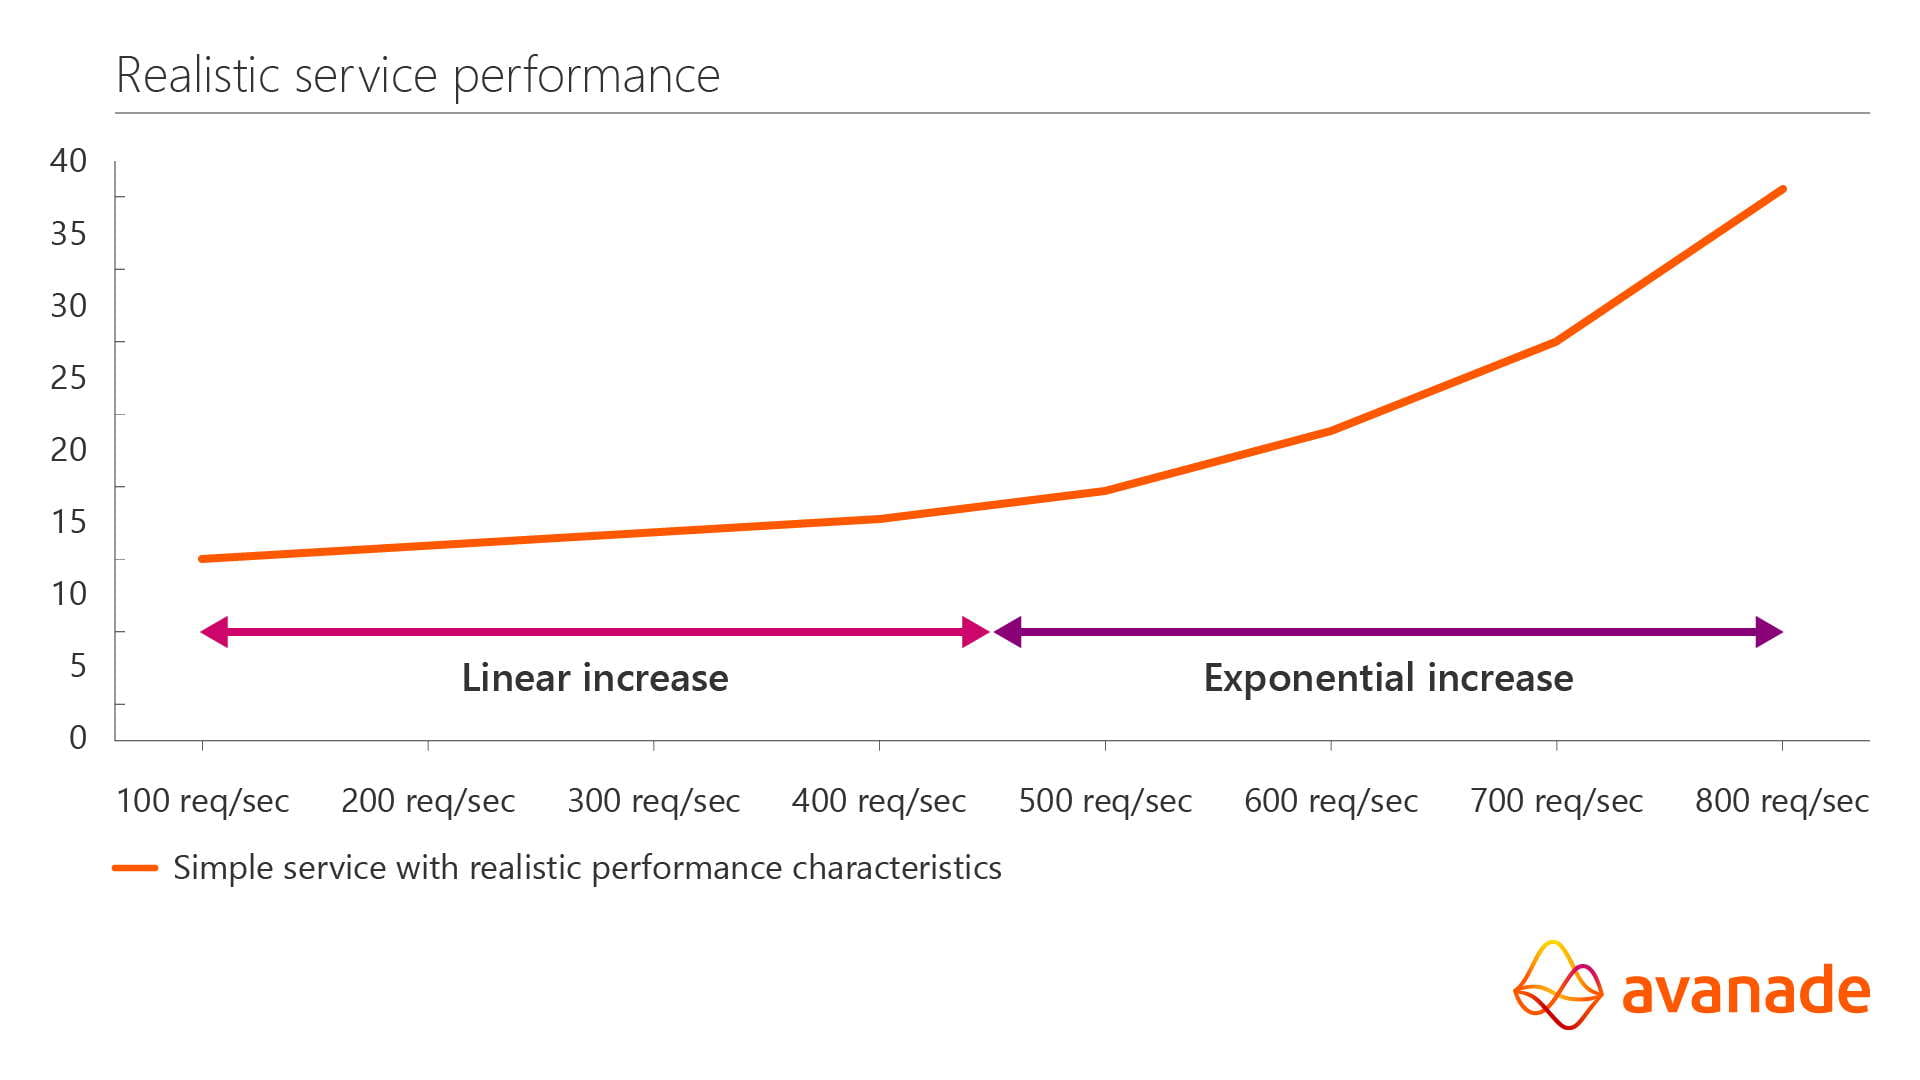
Clearly here we have some contention always (which must be true to explain the gentle rise of latency up to 400 req/sec) and clearly there is a more serious problem above 400 req/sec. If traffic gets up to those levels, latency quickly doubles! If you make real fixes to the performance, this line will shift and change shape based on what you have done. And operationally clearly this service should be capped at 400 req/sec for good performance.
Conclusion
Although it is true latency may increase with load, it is important to remember that indicates a performance issue. If it increases, you may want to check for resource saturation, but real applications are not so ideal. Checking for things like contention problems within the application is important also. But as I have shown, it is important to keep in mind that constant latency is the ideal, and deviations are always informing you about a performance issue. Deciding how important the issue is can be more complex, but knowing that helps you decide when to address performance issues, and also check that you have improved performance. In future articles, I will touch on finding issues in more complex applications, and good methodology to quickly identify and prioritize performance issues.
Hopefully you enjoyed this article, and if you want to read more about these topics, I recommend Brendan Gregg’s book “Systems Performance: Enterprise and the Cloud”.

Steven Parker
Steven Parker works as a Full Stack Architect at Avanade Norway and has many years’ experience working with software engineering, operating systems, software development, project management. Originally from the US, Steve worked many years for Apple, Sun Microsystems and Fujitsu before joining Avanade earlier this year.

